Mandalwise Rainfall (mm) Data for the year 2022-23 |
|
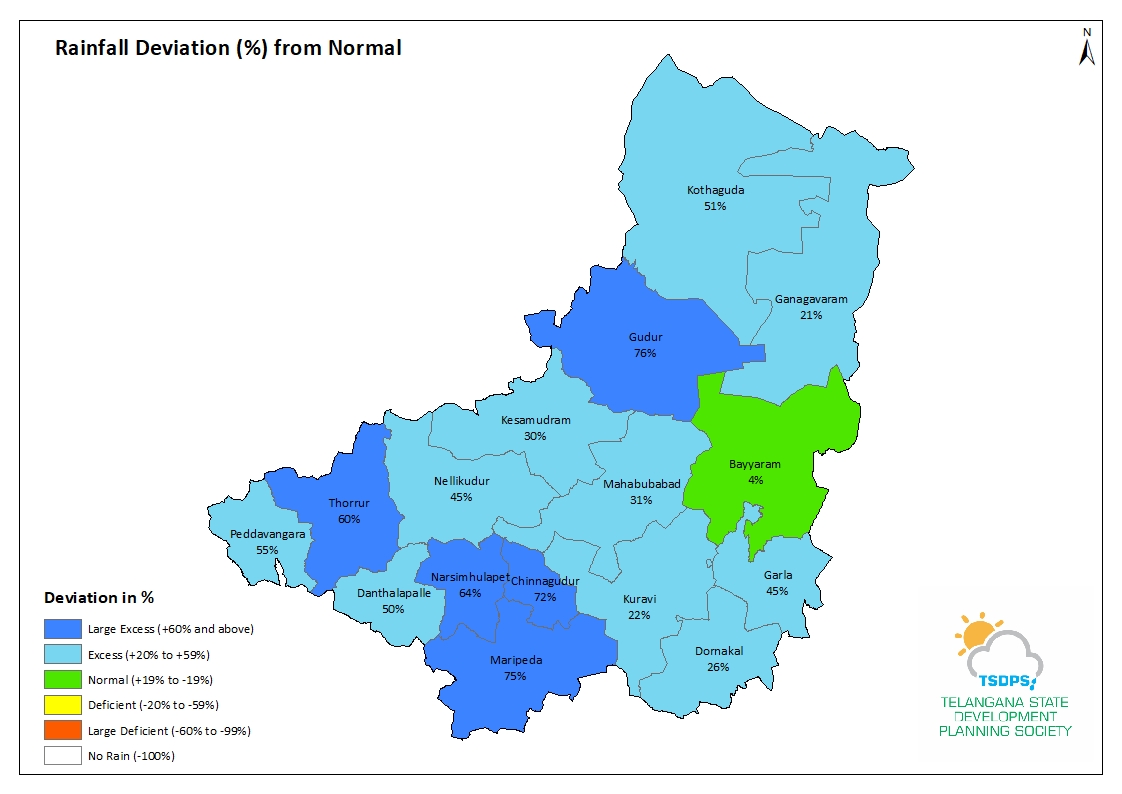
District: Mahabubabad |
|
|
|||||||||||||
Mandalwise Rainfall (mm) Data |
Export to Excel : |
||||||||||||
| Sno | Mandal | Cummulative Rainfall (mm) From 01.06.2022 to 31.05.2023 |
|||||||||||
| Actual | Normal | Deviation(%) | Status(%) | ||||||||||
| 1 | Gudur | 2018.5 | 1148.5 | 76.0 | Large Excess | ||||||||
| 2 | Thorrur | 1449.3 | 904.6 | 60.0 | Large Excess | ||||||||
| 3 | Narsimhulapet | 1375.4 | 840.5 | 64.0 | Large Excess | ||||||||
| 4 | Chinnagudur | 1421.2 | 824.6 | 72.0 | Large Excess | ||||||||
| 5 | Maripeda | 1439.1 | 824.6 | 75.0 | Large Excess | ||||||||
| 6 | Kothaguda | 1767.1 | 1166.7 | 51.0 | Excess | ||||||||
| 7 | Garla | 1462.1 | 1006.0 | 45.0 | Excess | ||||||||
| 8 | Dornakal | 1193.2 | 949.2 | 26.0 | Excess | ||||||||
| 9 | Mahabubabad | 1430.1 | 1087.7 | 31.0 | Excess | ||||||||
| 10 | Ganagavaram | 1407.3 | 1166.7 | 21.0 | Excess | ||||||||
| 11 | Kesamudram | 1378.4 | 1057.6 | 30.0 | Excess | ||||||||
| 12 | Danthalapalle | 1439.7 | 959.3 | 50.0 | Excess | ||||||||
| 13 | Peddavangara | 1311.4 | 847.0 | 55.0 | Excess | ||||||||
| 14 | Kuravi | 1297.3 | 1062.9 | 22.0 | Excess | ||||||||
| 15 | Bayyaram | 1260.0 | 1212.3 | 4.0 | Normal | ||||||||
| 16 | Nellikudur | 1541.5 | 1065.0 | 45.0 | Excess | ||||||||