Mandalwise Rainfall (mm) Data for the year 2022-23 |
|
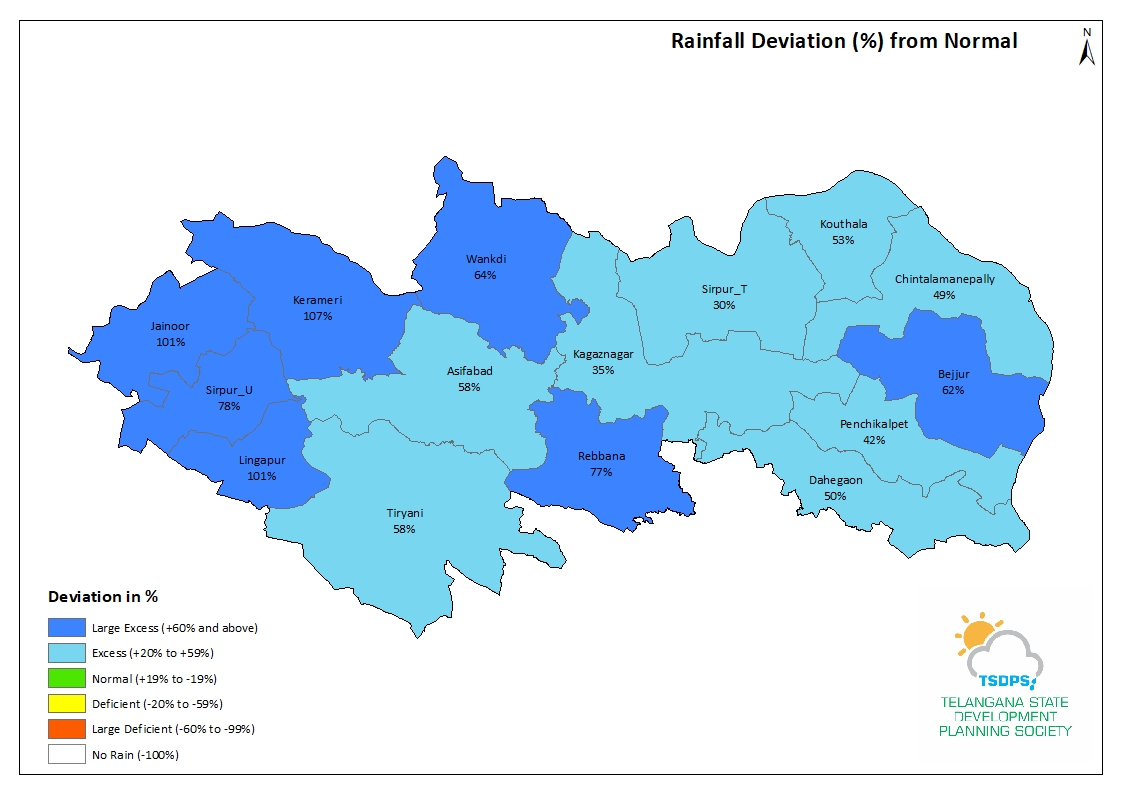
District: Kumaram Bheem-Asifabad |
|
|
|||||||||||||
Mandalwise Rainfall (mm) Data |
Export to Excel : |
||||||||||||
| Sno | Mandal | Cummulative Rainfall (mm) From 01.06.2022 to 31.05.2023 |
|||||||||||
| Actual | Normal | Deviation(%) | Status(%) | ||||||||||
| 1 | Jainoor | 2703.0 | 1342.1 | 101.0 | Large Excess | ||||||||
| 2 | Sirpur_U | 2287.8 | 1282.1 | 78.0 | Large Excess | ||||||||
| 3 | Kerameri | 2263.8 | 1096.1 | 107.0 | Large Excess | ||||||||
| 4 | Lingapur | 2395.8 | 1194.0 | 101.0 | Large Excess | ||||||||
| 5 | Rebbana | 1902.1 | 1072.7 | 77.0 | Large Excess | ||||||||
| 6 | Wankdi | 1889.4 | 1149.1 | 64.0 | Large Excess | ||||||||
| 7 | Bejjur | 2043.5 | 1263.7 | 62.0 | Large Excess | ||||||||
| 8 | Dahegaon | 1866.1 | 1242.0 | 50.0 | Excess | ||||||||
| 9 | Penchikalpet | 1729.1 | 1221.3 | 42.0 | Excess | ||||||||
| 10 | Kagaznagar | 1559.0 | 1156.9 | 35.0 | Excess | ||||||||
| 11 | Chintalamanepally | 1840.5 | 1237.3 | 49.0 | Excess | ||||||||
| 12 | Sirpur_T | 1636.4 | 1259.9 | 30.0 | Excess | ||||||||
| 13 | Tiryani | 1723.6 | 1092.9 | 58.0 | Excess | ||||||||
| 14 | Asifabad | 1798.1 | 1134.6 | 58.0 | Excess | ||||||||
| 15 | Kouthala | 1820.9 | 1188.3 | 53.0 | Excess | ||||||||