Mandalwise Rainfall (mm) Data for the year 2022-23 |
|
District: Hyderabad |
|
|
|||||||||||||
Mandalwise Rainfall (mm) Data |
Export to Excel : |
||||||||||||
| Sno | Mandal | Cummulative Rainfall (mm) From 01.06.2022 to 31.05.2023 |
|||||||||||
| Actual | Normal | Deviation(%) | Status(%) | ||||||||||
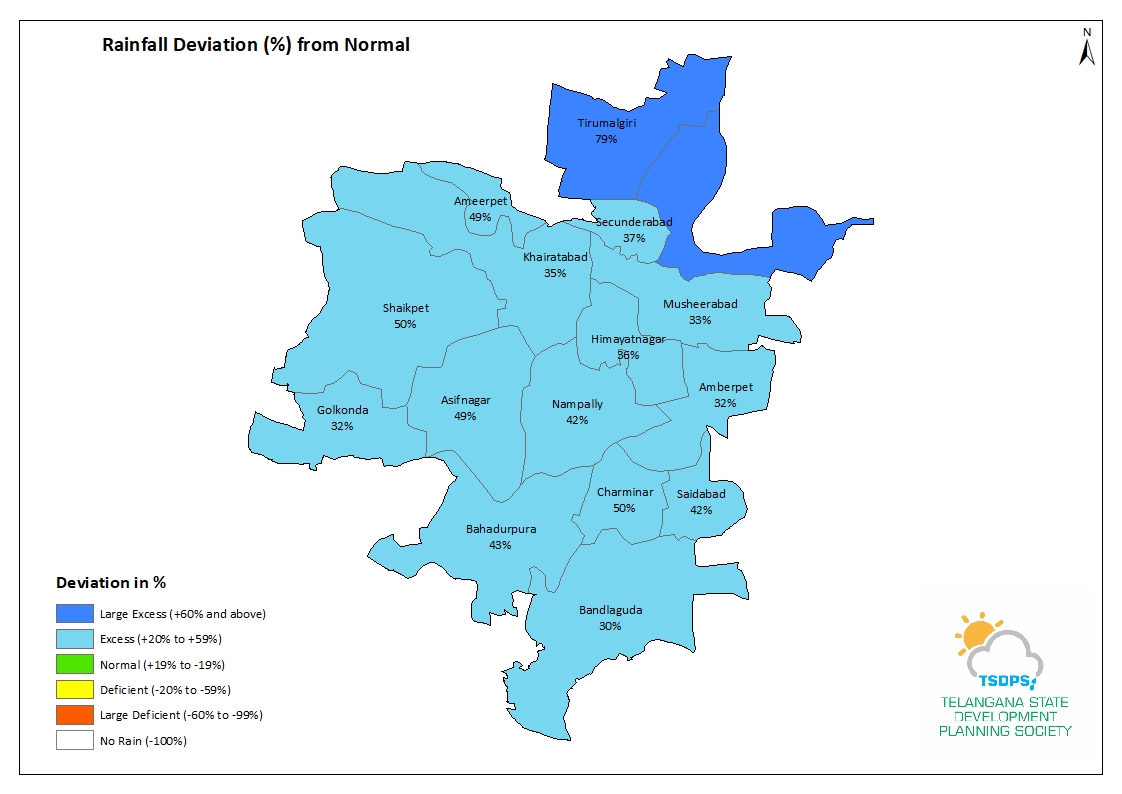
| 1 | Tirumalgiri | 1451.2 | 809.1 | 79.0 | Large Excess | ||||||||
| 2 | Maredpally | 1296.6 | 809.2 | 60.0 | Large Excess | ||||||||
| 3 | Ameerpet | 1207.5 | 809.2 | 49.0 | Excess | ||||||||
| 4 | Musheerabad | 1080.1 | 811.1 | 33.0 | Excess | ||||||||
| 5 | Amberpet | 1070.4 | 809.2 | 32.0 | Excess | ||||||||
| 6 | Himayatnagar | 1098.1 | 809.2 | 36.0 | Excess | ||||||||
| 7 | Shaikpet | 1122.4 | 749.4 | 50.0 | Excess | ||||||||
| 8 | Asifnagar | 1115.3 | 749.4 | 49.0 | Excess | ||||||||
| 9 | Bahadurpura | 1073.7 | 749.4 | 43.0 | Excess | ||||||||
| 10 | Saidabad | 1065.4 | 749.4 | 42.0 | Excess | ||||||||
| 11 | Khairatabad | 1089.8 | 809.2 | 35.0 | Excess | ||||||||
| 12 | Nampally | 1061.0 | 749.4 | 42.0 | Excess | ||||||||
| 13 | Golkonda | 985.6 | 749.4 | 32.0 | Excess | ||||||||
| 14 | Bandlaguda | 976.5 | 749.4 | 30.0 | Excess | ||||||||
| 15 | Charminar | 1119.2 | 744.7 | 50.0 | Excess | ||||||||
| 16 | Secunderabad | 1108.2 | 809.2 | 37.0 | Excess | ||||||||