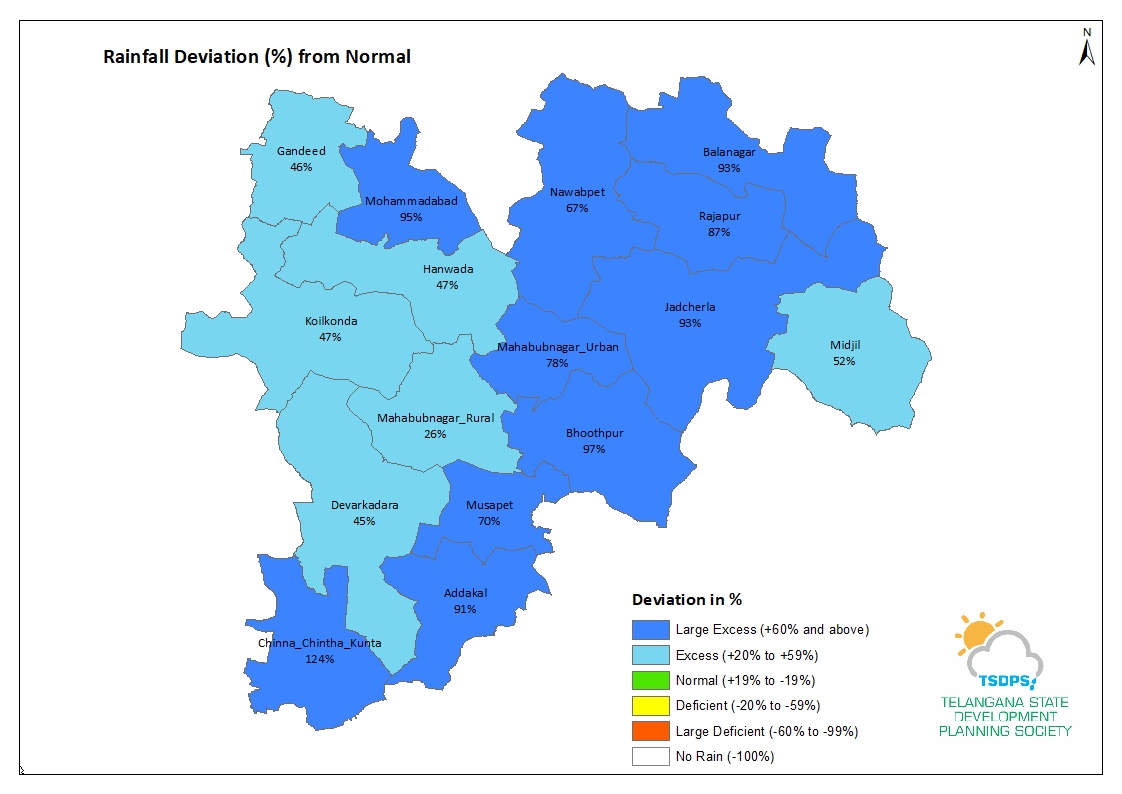
Mandalwise Rainfall (mm) Data for the year 2022-23 |
|
District: Mahabubnagar |
|
|
|||||||||||||
Mandalwise Rainfall (mm) Data |
Export to Excel : |
||||||||||||
| Sno | Mandal | Cummulative Rainfall (mm) From 01.06.2022 to 31.05.2023 |
|||||||||||
| Actual | Normal | Deviation(%) | Status(%) | ||||||||||
| 1 | Chinna_Chintha_Kunta | 1115.0 | 496.7 | 124.0 | Large Excess | ||||||||
| 2 | Addakal | 1188.6 | 621.8 | 91.0 | Large Excess | ||||||||
| 3 | Nawabpet | 1018.5 | 608.1 | 67.0 | Large Excess | ||||||||
| 4 | Musapet | 1056.5 | 620.0 | 70.0 | Large Excess | ||||||||
| 5 | Bhoothpur | 1234.4 | 625.5 | 97.0 | Large Excess | ||||||||
| 6 | Mahabubnagar_Urban | 1271.4 | 715.2 | 78.0 | Large Excess | ||||||||
| 7 | Balanagar | 1148.5 | 596.3 | 93.0 | Large Excess | ||||||||
| 8 | Rajapur | 1113.0 | 596.3 | 87.0 | Large Excess | ||||||||
| 9 | Mohammamdabad | 1365.3 | 700.9 | 95.0 | Large Excess | ||||||||
| 10 | Jadcherla | 1217.1 | 629.5 | 93.0 | Large Excess | ||||||||
| 11 | Koilkonda | 918.4 | 625.3 | 47.0 | Excess | ||||||||
| 12 | Gandeed | 1024.0 | 700.9 | 46.0 | Excess | ||||||||
| 13 | Hanwada | 984.3 | 668.6 | 47.0 | Excess | ||||||||
| 14 | Mahabubnagar_Rural | 811.6 | 645.8 | 26.0 | Excess | ||||||||
| 15 | Devarkadara | 917.7 | 635.0 | 45.0 | Excess | ||||||||
| 16 | Midjil | 937.4 | 618.4 | 52.0 | Excess | ||||||||
