Mandalwise Rainfall (mm) Data for the year 2022-23 |
|
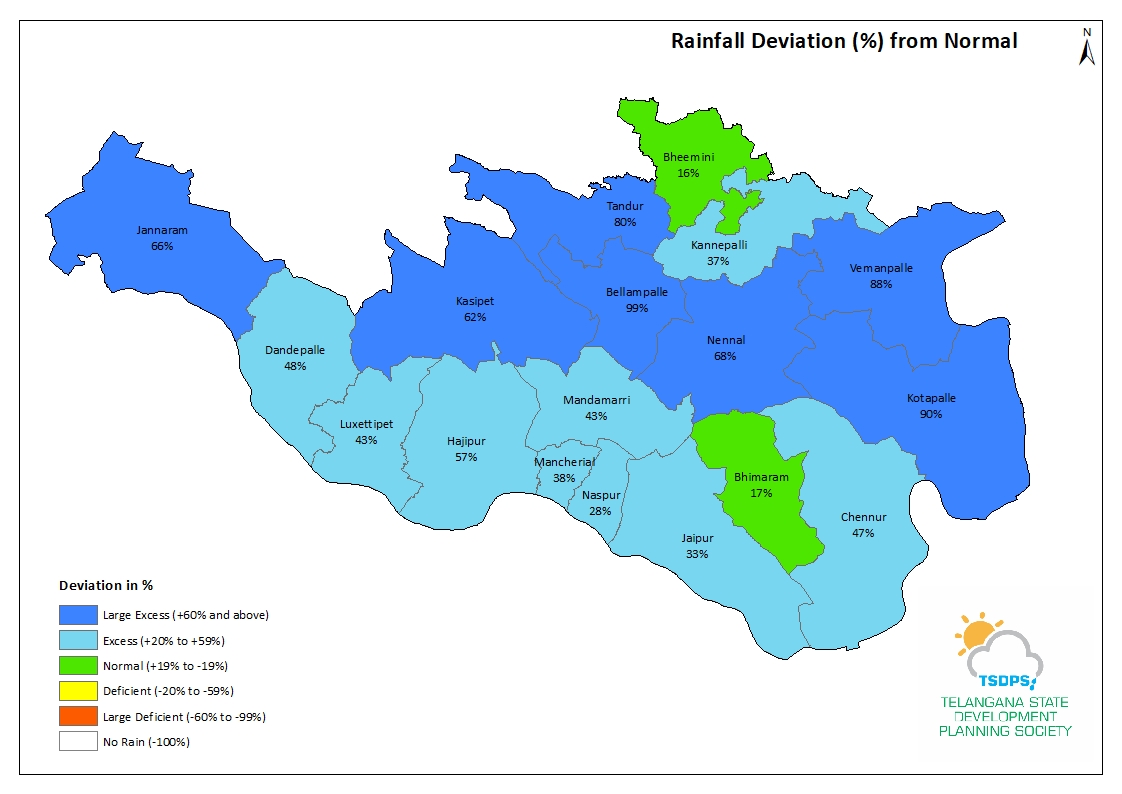
District: Mancherial |
|
|
|||||||||||||
Mandalwise Rainfall (mm) Data |
Export to Excel : |
||||||||||||
| Sno | Mandal | Cummulative Rainfall (mm) From 01.06.2022 to 31.05.2023 |
|||||||||||
| Actual | Normal | Deviation(%) | Status(%) | ||||||||||
| 1 | Vemanpalle | 2206.0 | 1172.2 | 88.0 | Large Excess | ||||||||
| 2 | Nennal | 1919.3 | 1142.3 | 68.0 | Large Excess | ||||||||
| 3 | Bellampalle | 2008.5 | 1007.8 | 99.0 | Large Excess | ||||||||
| 4 | Kotapalle | 2105.5 | 1107.2 | 90.0 | Large Excess | ||||||||
| 5 | Jannaram | 2102.1 | 1264.6 | 66.0 | Large Excess | ||||||||
| 6 | Kasipet | 1802.8 | 1113.3 | 62.0 | Large Excess | ||||||||
| 7 | Tandur | 1896.1 | 1056.3 | 80.0 | Large Excess | ||||||||
| 8 | Kannepalli | 1678.1 | 1220.5 | 37.0 | Excess | ||||||||
| 9 | Chennur | 1711.0 | 1161.3 | 47.0 | Excess | ||||||||
| 10 | Jaipur | 1686.6 | 1264.9 | 33.0 | Excess | ||||||||
| 11 | Dandepalle | 1591.7 | 1076.7 | 48.0 | Excess | ||||||||
| 12 | Hajipur | 1751.1 | 1116.2 | 57.0 | Excess | ||||||||
| 13 | Mancherial | 1539.4 | 1116.2 | 38.0 | Excess | ||||||||
| 14 | Naspur | 1430.3 | 1116.2 | 28.0 | Excess | ||||||||
| 15 | Luxettipet | 1559.8 | 1092.8 | 43.0 | Excess | ||||||||
| 16 | Bheemini | 1446.3 | 1249.7 | 16.0 | Normal | ||||||||
| 17 | Bhimaram | 1474.4 | 1264.9 | 17.0 | Normal | ||||||||
| 18 | Mandamarri | 1533.4 | 1072.7 | 43.0 | Excess | ||||||||