Mandalwise Rainfall (mm) Data for the year 2022-23 |
|
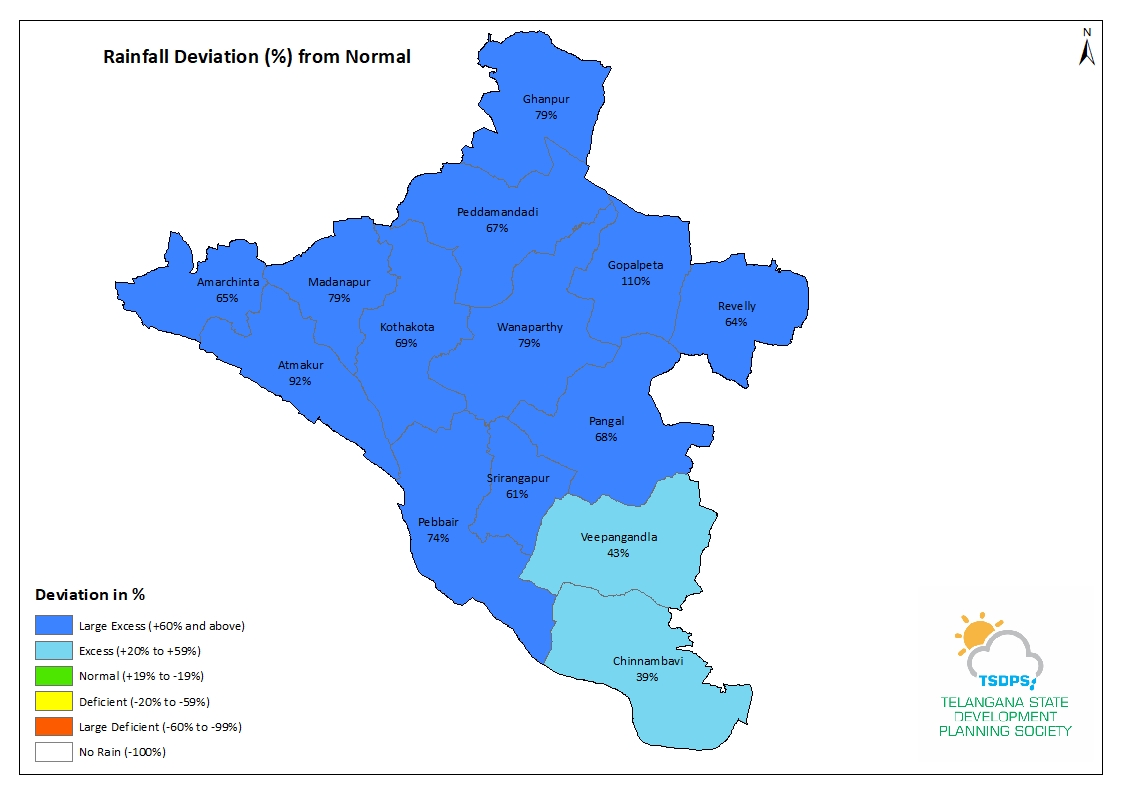
District: Wanaparthy |
|
|
|||||||||||||
Mandalwise Rainfall (mm) Data |
Export to Excel : |
||||||||||||
| Sno | Mandal | Cummulative Rainfall (mm) From 01.06.2022 to 31.05.2023 |
|||||||||||
| Actual | Normal | Deviation(%) | Status(%) | ||||||||||
| 1 | Amarchinta | 940.7 | 570.4 | 65.0 | Large Excess | ||||||||
| 2 | Peddamandadi | 999.2 | 599.9 | 67.0 | Large Excess | ||||||||
| 3 | Gopalpeta | 1321.7 | 629.3 | 110.0 | Large Excess | ||||||||
| 4 | Revelly | 1034.6 | 629.3 | 64.0 | Large Excess | ||||||||
| 5 | Pangal | 805.5 | 479.2 | 68.0 | Large Excess | ||||||||
| 6 | Wanaparthy | 1228.8 | 685.4 | 79.0 | Large Excess | ||||||||
| 7 | Atmakur | 1116.3 | 582.0 | 92.0 | Large Excess | ||||||||
| 8 | Pebbair | 932.2 | 536.0 | 74.0 | Large Excess | ||||||||
| 9 | Srirangapur | 865.3 | 536.0 | 61.0 | Large Excess | ||||||||
| 10 | Madanapur | 966.9 | 540.5 | 79.0 | Large Excess | ||||||||
| 11 | Ghanpur | 1090.1 | 607.5 | 79.0 | Large Excess | ||||||||
| 12 | Kothakota | 922.5 | 544.3 | 69.0 | Large Excess | ||||||||
| 13 | Veepangandla | 838.6 | 587.2 | 43.0 | Excess | ||||||||
| 14 | Chinnambavi | 817.1 | 587.2 | 39.0 | Excess | ||||||||